
The gap isn't a lack of data. It's a lack of structure. A true analytics report answers three critical questions: what happened, why it happened, and what to do next. This guide covers how to build and present a social media analytics report that drives decisions—not one that collects dust. You'll learn what to include, which metrics actually matter, and how to avoid the most common pitfalls that undermine reporting credibility.
Key Takeaways
- Answer three questions in every report: what happened, why it happened, and what action to take next
- Structure matters—use distinct sections: executive summary, goals and KPIs, channel performance, insights, and next actions
- Map metrics to funnel stages: awareness (reach, impressions), engagement (engagement rate, saves), conversion (CTR, CVR, CPA)
- Lead with narrative and strategic recommendations—not a chart-by-chart walkthrough
- The most common mistake: tracking metrics that aren't tied to any business goal
What Is a Social Media Analytics Report (and Why It Matters)
A social media analytics report is a structured document that compiles platform data—both real-time and historical—to evaluate social media performance against defined business goals. It transforms raw numbers from Facebook, Instagram, LinkedIn, TikTok, and other platforms into actionable insights that guide strategy.
Why does this matter beyond vanity metrics? 86% of marketers use Facebook, 81% use Instagram, and 76% use LinkedIn for marketing, generating massive amounts of performance data. A well-built report ties that activity to business outcomes like lead generation, brand awareness, audience growth, and revenue—making social media accountable at the organizational level.
What separates a report stakeholders act on from one they file away comes down to three things:
- Defined KPIs tied to actual business goals, not just platform defaults
- Consistent cadence so trends are visible over time, not just snapshots
- Executive-ready formatting that surfaces the right insights without burying them in raw data
Get those right, and the numbers do the work. Miss them, and even strong performance goes unnoticed.
How to Build Your Social Media Analytics Report: Step-by-Step
Step 1: Define Goals and Set the Reporting Period
A report without clearly defined goals is just a spreadsheet. Every metric included should connect to a goal—awareness, engagement, traffic, or conversion. 59% of CMOs report insufficient budget, and 46% are focused on prioritizing growth, which means your report must justify investment by linking social activity to business outcomes.
Reporting cadence matters:
- Weekly reports: For internal optimization and quick tactical adjustments
- Monthly reports: For client and leadership reviews, strategic evaluation
- Quarterly reports: For strategic planning and long-term trend analysis
Consistent cadence allows you to track trends, compare performance across periods, and build stakeholder trust over time.
Step 2: Write the Executive Summary
The executive summary is the first thing stakeholders read—and often the only thing. It should surface only top KPIs, performance highlights, and one-line takeaways without requiring anyone to dig further.
What to include:
- 3-5 core metrics maximum
- Directional insight for each metric (e.g., "Engagement rate grew 12% due to increased video content")
- Clear performance indicators (color-coded or trend arrows)
Keep it to 150-200 words total. If an executive can't grasp your key findings in 30 seconds, the summary needs work. A tight, scannable summary also sets the tone for how the rest of the report will be read.
Step 3: Build the Goals and KPIs Section
Group KPIs under goal categories so the report is organized by intent, not by platform. Industry best practice recommends tracking 3-5 core KPIs per business objective to maintain focus and avoid data overload.
Standard KPI categories:
- Awareness: Reach, impressions, follower growth rate, share of voice
- Engagement: Engagement rate, saves, shares, video completion rate, comment sentiment
- Traffic: Click-through rate, website visits, landing page conversions
- Conversions: Conversion rate, cost per acquisition, social-attributed revenue
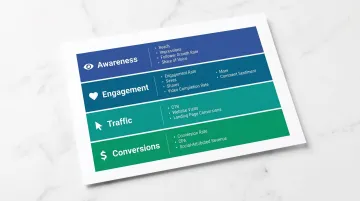
Use color-coded indicators or trend arrows to communicate direction at a glance. Each goal should tie directly back to the business objectives set during discovery.
Step 4: Add Channel-by-Channel Performance
Dedicate a section to each platform—Instagram, LinkedIn, Facebook, TikTok, YouTube—showing top-performing content, engagement breakdown by format, and audience growth.
Go beyond totals: Break down performance by content type (video vs. carousel vs. static) to reveal what formats are working. 71% of video marketers identify short-form video as the top ROI driver, compared to only 22% for long-form video. Content format analysis should feature prominently in this section.
Platform-specific considerations:
- Facebook: Organic reach is approximately 1.1-2.2% and declining
- Instagram: Organic reach ranges from 7-9% but declined 30-40% in 2025
- TikTok: Engagement rates remain higher than other platforms, with median engagement around 2.63%
Flag when organic reach declines suggest paid amplification is necessary.
Step 5: Write the Insights and Learnings Section
Channel data tells you what happened. This section explains why—and what to do next. Use a four-part insight framework:
- Objective: What was the goal?
- Performance: What did the numbers show?
- Insight: Why did performance shift?
- Action: What should we do next?
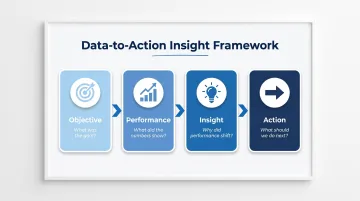
Every insight should close with a specific, actionable next step tied to the data. This data-to-action approach is what separates reporting from analysis. At WideFoc.us, this methodology has helped clients reach over 20 million impressions and 1 million link clicks—results that trace directly back to consistent, structured reporting applied over time.
Which Metrics Belong in Your Social Media Analytics Report?
Tracking too many metrics creates noise. A focused report limits each goal to a handful of core metrics that actually move business results.
Awareness and Reach Metrics
- Impressions: Total number of times your content is displayed, regardless of clicks
- Reach: Total number of unique users who see your content
One user can generate multiple impressions but counts as one unit of reach. Impressions measure content visibility; reach measures audience size.
Follower Growth Rate: Track percentage growth, not just raw follower counts. A 5% monthly growth rate is more meaningful than adding 500 followers when you already have 10,000.
Share of Voice (SOV): Share of voice measures the market your brand owns compared to competitors. Formula: (Your brand mentions / Total industry mentions) x 100. Calculated using social listening tools, SOV tells you how much of the relevant industry conversation your brand actually owns.
Engagement and Consideration Metrics
Engagement Rate: Formula: Total interactions (likes, comments, shares, saves) divided by reach or impressions. Raw like counts ignore audience size; engagement rate normalizes performance across accounts of any size.
Cross-industry median engagement rates by platform:
- TikTok: 2.63%
- Instagram: 0.43%
- Facebook: 0.063%
- X (Twitter): 0.029%
Critical note: Engagement rates declined across all platforms in 2024—Facebook dropped 36%, Instagram 16%, TikTok 34%, and X 48% year-over-year. Contextualize your performance against declining industry baselines, not static benchmarks.
Not all interactions carry equal weight. Instagram's algorithm now prioritizes saves, shares, and DM sends over likes — and these signals translate directly to organic reach. Track these metrics accordingly:
- Saves: Indicate content users want to reference later
- Share rate: Signals audience endorsement and content amplification
- Video completion rate: Measures content quality and viewer retention
- Comment sentiment: Tracks qualitative audience response
Conversion and Action Metrics
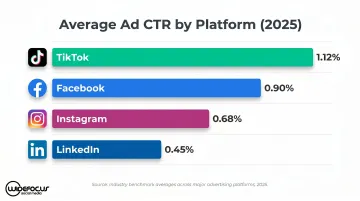
Click-Through Rate (CTR): Percentage of people who clicked a link after seeing your content. Average ad CTR benchmarks by platform:
- Facebook: 0.90%
- Instagram: 0.68%
- TikTok: 1.12%
- LinkedIn: 0.45%
Conversion Rate (CVR): Percentage of users who completed a desired action after clicking through. Typical social media CVR ranges from 1-5% depending on industry, funnel stage, and offer relevance.
Cost Per Acquisition (CPA): Total campaign cost divided by number of conversions. Use CPA to benchmark campaign efficiency over time and justify budget allocation by channel.
Social Media Attributed Revenue: The most important metric for proving ROI to leadership. This requires proper UTM tagging and attribution setup. Only 30% of marketers believe they can effectively measure social media ROI, largely because attribution setup is inconsistent or incomplete.
Awareness formats contribute 28% of conversion assists — meaning upper-funnel social content drives measurable revenue impact even when it's not the last click before purchase.
How to Present Your Social Media Analytics Report Effectively
Presenting a report is different from sending one. The goal is to walk stakeholders through a story, not narrate a spreadsheet row by row.
Tailor the Report to Your Audience
Different audiences need different levels of detail:
Executives:
- Need the summary, the trend, and the decision
- Focus on 3-5 top-level KPIs
- Emphasize business outcomes (revenue, leads, CAC)
- Keep it to 5 minutes or less
Marketing teams:
- Need channel breakdowns and tactical recommendations
- Show content performance by format
- Include optimization opportunities
- Provide context for what to test next
Clients:
- Need to see the work, the wins, and the plan
- Balance performance data with examples of content created
- Connect results back to their stated goals
- Close with clear next actions
Translating raw platform data into clear, audience-appropriate narratives is one of the harder skills in social media reporting — and one of the most valuable.
Lead With the Story, Not the Data
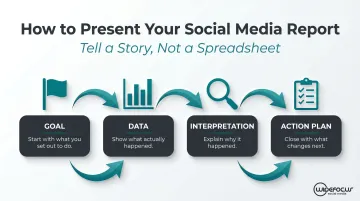
Use a narrative arc:
- Start with what you set out to do — the original goal
- Show what actually happened — the data
- Explain why — your interpretation
- Close with what you're changing next — the action plan
Every chart or visual should support this arc, not interrupt it. Don't read charts aloud—stakeholders can see the numbers. Your job is to interpret what the numbers mean and what to do about them.
Use Visualization to Support, Not Overwhelm
Charts, graphs, and trend arrows make performance easier to read quickly.
Best practices:
- Use line charts for trend data over time
- Use bar charts for comparative data across channels
- Limit each slide or section to one key insight
- Apply consistent color coding across periods
Establish a consistent report template so stakeholders can compare performance at a glance without reorienting each time. When the format stays the same, the conversation shifts from "how do I read this?" to "what does this mean for us?"
Common Mistakes to Avoid When Building Analytics Reports
Four pitfalls consistently undercut otherwise solid analytics work:
Tracking vanity metrics in isolation. Impressions and follower counts mean nothing without context. Sprout Social notes that reach, CTR, and impressions aren't built to prove real business impact. Every metric should ladder up to a defined objective.
Reporting on too many platforms or metrics at once. A bloated report loses stakeholder attention fast. Focus on channels where the brand is most active and track 3-5 core KPIs per business objective, not every available data point.
Skipping the insights section. Raw data forces stakeholders to draw their own conclusions — often the wrong ones. Interpretation is where the report earns its strategic value.
Changing the format or date range each month. Inconsistency makes trend comparison impossible. Poor data quality and inconsistent tracking severely damage report credibility and mislead decision-makers.
Frequently Asked Questions
What should a social media analytics report include?
A complete report includes five core sections: an executive summary highlighting 3-5 top KPIs, a goals and KPIs section organized by business objective, channel-by-channel performance breakdowns showing content type analysis, an insights and learnings section with the Objective → Performance → Insight → Action framework, and recommended next actions tied directly to the data.
What is a social media analytics report?
A social media analytics report is a structured document that compiles platform data to evaluate social media performance against business goals. It helps teams and clients make informed decisions by turning raw metrics into clear direction across awareness, engagement, traffic, and conversions.
What are examples of social media analytics?
Concrete examples span the full funnel: impressions and reach for awareness, engagement rate and video completion rate for consideration, click-through rate and website visits for traffic, conversion rate and cost per acquisition for conversions, and sentiment analysis for brand perception.
What are the 4 types of social media analytics?
The four types are descriptive (what happened—summarizes historical data through KPI dashboards), diagnostic (why it happened—investigates causes through root cause analysis), predictive (what might happen—forecasts future outcomes using historical patterns), and prescriptive (what you should do—recommends specific actions to optimize results). This classification originates from Gartner's data analytics framework.
What is social media actions analytics?
Actions analytics tracks what users do after seeing content: clicks, saves, shares, website visits, and conversions. This represents the deepest level of audience engagement, moving beyond passive metrics like views or impressions to measure active behaviors that signal genuine interest and intent.
What are the 7 layers of social media analytics?
Developed by researcher Gohar F. Khan, the 7 layers framework covers: text analytics, actions analytics (likes, shares), network analytics, hyperlink analytics, mobile app analytics, search engine analytics, and location analytics — moving from basic post performance through to strategic attribution.