Introduction
Financial services brands face a social media challenge unlike any other industry. They must navigate high trust demands, strict regulatory scrutiny, and audiences spanning multiple generations—with little margin for error when one misstep can damage reputation overnight.
Yet the stakes for getting social media right have never been higher. According to the Federal Reserve Bank of Philadelphia, 79% of Gen Z and Millennials now use social media to seek financial advice. For financial institutions, that's not a trend to monitor—it's a fundamental change in where clients first form opinions about financial professionals.
What separates firms that succeed on social media from those that struggle is analytics. Successful financial services brands measure what works, track audience behavior, and use data to make smarter decisions over time.
This guide covers the essential analytics framework for financial services:
- Key performance indicators worth tracking
- Platform-specific analytics by channel
- Compliance monitoring through data
- Industry benchmarks
- Building a data-backed social media strategy that drives real business results
Key Takeaways
- Analytics turns social media into a measurable, accountable channel — not a budget line you defend on gut instinct
- Track engagement rate, reach, lead conversions, share of voice, and sentiment—follower count alone means nothing
- LinkedIn and Facebook lead financial services marketing, but your audience data should dictate platform choice — not industry defaults
- Compliance monitoring through analytics identifies reputational risks and regulatory concerns before they escalate
- Use financial services-specific benchmarks — not generic social media averages — to set goals that actually mean something
Why Social Media Analytics Are Non-Negotiable for Financial Services
Analytics matter more in financial services than in almost any other industry. Decisions made without data can violate compliance norms, misallocate limited budgets, or erode trust with audiences who hold financial professionals to exceptionally high standards.
The stakes are measurable: BlackRock research shows that 23% of Gen Z adults would not even consider a financial professional who lacks a social media presence. The opportunity cost of operating without analytics only grows as younger clients become the dominant market.
Analytics solves specific challenges unique to financial services:
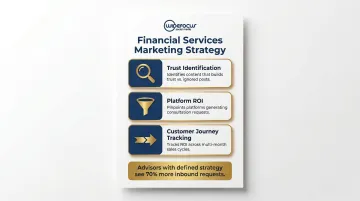
- Identifies which content builds trust versus what audiences scroll past — financial consumers respond differently to promotional messaging than retail shoppers do
- Pinpoints which platforms actually generate consultation requests, not just impressions
- Tracks ROI across a customer journey that can stretch months from first post to signed client
These insights shift financial brands from reactive to proactive. By spotting what audiences respond to and catching sentiment shifts early, firms can adapt content before performance drops. Broadridge reports that advisors with a defined marketing strategy see a 70% increase in inbound requests, compared to just 44% for those without one.
Compliance and Trust as Analytics Drivers
In a regulated industry, analytics isn't just a marketing tool—it's also a risk management function. Monitoring how content performs and how audiences react flags messaging that may be perceived as misleading, helping teams adjust before regulators take notice. With the SEC having imposed more than $3 billion in combined penalties on 100+ firms since December 2021 for off-channel communication failures, the compliance case for analytics is as strong as the marketing one.
The Key Social Media Metrics Financial Services Brands Must Track
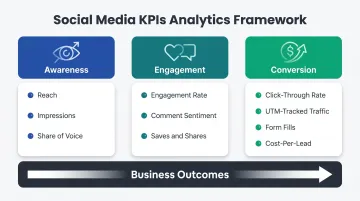
For financial services brands, not all social metrics are created equal. The ones worth tracking tie directly to business outcomes — not just activity. Organize your measurement framework across three categories: awareness, engagement, and conversion.
Awareness Metrics
Reach measures how many unique users saw your content. Impressions count total views, including repeat views by the same user. Share of voice compares how often your brand appears in conversations versus competitors — particularly valuable for topics like mortgage rates, investment advice, or retirement planning. This metric tells you whether your content is positioning you as a thought leader or getting drowned out by the competition.
Engagement Metrics
Engagement rate is the percentage of people who interacted with your content after seeing it. Hootsuite's 2025 benchmark data shows financial services engagement rates by platform:
- Instagram: 3.8%
- LinkedIn: 3.2%
- X (Twitter): 2.1%
- Facebook: 1.8%
- TikTok: 1.6%
Comment sentiment reveals whether conversations about your brand skew positive, neutral, or negative. Saves and shares signal that audiences trusted your content enough to bookmark it — a strong credibility indicator in financial services, where consumers are cautious about who they take advice from.
Conversion and Lead Metrics
These are the metrics that connect social media to revenue:
- Click-through rates from posts to product or service pages
- UTM-tracked traffic from social channels to landing pages
- Form fills and consultation requests originating from social content
- Cost-per-lead from paid social campaigns
Connecting social analytics to your CRM reveals the full customer journey — from a LinkedIn post to a signed client. That integration is what separates strategic measurement from surface-level reporting.
Choosing the Right Platforms and Understanding Their Analytics
Platform selection should be driven by where target audiences actually are, not by assumption. The dominant platforms for financial services and their core analytics value:
| Platform | Primary Value | Top Metric to Track |
|---|---|---|
| Professional audience reach, thought leadership performance | Engagement rate on posts (3.2% avg), share of voice among competitors | |
| Community engagement, paid ad performance tracking | Ad conversion rate (8.98% avg), cost per lead ($41.28 avg) | |
| Visual content engagement, younger demographic insights | Engagement rate (3.8% avg), follower growth rate (2.26% avg) | |
| YouTube | Educational content retention, video view-through rates | Watch time, video completion rate |
Broadridge's 2024 Financial Advisor Marketing Trends Report shows where advisors actually spend marketing dollars: 68% invest in LinkedIn and 50% invest in Facebook, making these the top two platforms for advisor marketing spend.
With significant budget flowing into LinkedIn and Facebook, tracking performance on both platforms simultaneously becomes a practical necessity. Native analytics — LinkedIn Analytics and Meta Business Suite — handle platform-level data well, but they don't talk to each other. Financial services brands managing multiple channels need unified dashboards to compare cross-platform performance in one view: cost-per-lead on Facebook against engagement rate on LinkedIn, for example. Third-party tools consolidate that data, making budget reallocation decisions faster and more defensible.
Building an Analytics-Driven Social Media Strategy for Financial Services
Start by defining measurable goals before building any content plan. Goals might include increasing qualified leads from LinkedIn by 25%, improving engagement rate on educational content to 4%, or growing organic reach among 35-50 year-olds by 30%. Without a pre-defined goal, analytics data has no context.
Using Analytics to Inform Content Mix
The 70/20/10 content framework is a starting point: 70% educational/value-driven content, 20% brand/culture content, 10% promotional content. Analytics data validates whether this ratio works—or signals when to adjust it. For financial services, educational content makes consumers 131% more likely to purchase, with 92% of millennials seeking financial education online. This data proves educational content should dominate your content calendar.
Posting Frequency and Timing
Analytics reveals optimal posting windows for each platform. Hootsuite's 2025 FinServ benchmark data shows:
- Facebook: Monday 8-9 AM, Tuesday 10 PM-12 AM
- Instagram: Wednesday 9-10 AM
- LinkedIn: Monday 5-7 AM, Tuesday 12-4 AM, Thursday 3-4 AM
Testing and iterating against your own audience data matters more than following generic advice. Your specific audience may behave differently.
Competitor Analytics Benchmarking
Use social listening tools to monitor competitor content performance, share of voice, and audience sentiment. This identifies gaps in your own strategy or opportunities to position differently. If competitors dominate conversations around retirement planning but neglect ESG investing, that's a content gap you can fill.
Keeping up with these analytics demands is where many financial firms struggle. Firms without dedicated social media teams often work with agencies like WideFoc.us, which has spent nearly two decades building data-driven strategies for both B2B and B2C financial clients. Ongoing expert oversight means your strategy adapts as your audience data evolves, rather than sitting static between quarterly reviews.
Using Analytics for Compliance Monitoring and Crisis Management
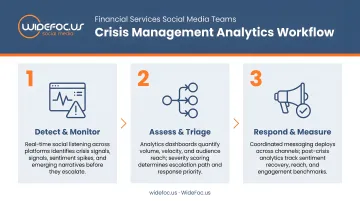
Analytics tools serve a dual function: performance tracking and early warning systems. Monitoring message volume spikes, sudden sentiment shifts, or unusual surges in brand mentions alerts teams to potential compliance issues or emerging PR crises before they escalate.
Social listening analytics supports FINRA, SEC, and CFPB compliance indirectly by:
- Tracking whether promotional content is generating misleading impressions
- Flagging negative sentiment around specific claims
- Creating an audit trail of how content performed
None of this replaces legal review — but it adds a documented layer of oversight. FINRA Rule 2210 requires that all communications with the public be fair, balanced, and not misleading. Analytics data creates the paper trail that demonstrates your content meets that bar.
Crisis Management Analytics Workflow
- Set spike alerts on incoming messages to detect unusual activity immediately
- Track sentiment in real time during a crisis event to gauge how audiences are reacting
- Analyze post-crisis data to measure how your response affected reputation scores and shifted engagement trends over time
The March 2024 FINRA enforcement action against M1 Finance resulted in an $850,000 fine for failing to review and approve influencer posts and retain communications. Analytics tools with built-in archiving help firms avoid these costly violations.
Social Media Benchmarks for Financial Services: What Good Looks Like
Key 2025 industry benchmarks for financial services, sourced from Hootsuite's FinServ benchmark report:
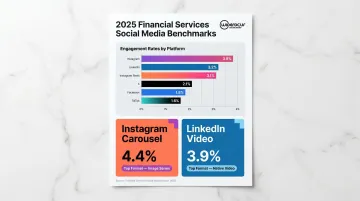
Engagement rates by platform:
- Instagram: 3.8%
- LinkedIn: 3.2%
- Instagram Reels: 3.1%
- X (Twitter): 2.1%
- Facebook: 1.8%
- TikTok: 1.6%
Follower growth rates by platform:
- Instagram: 2.26%
- TikTok: 0.98%
- Facebook: 0.61%
- LinkedIn: 0.51%
- X (Twitter): 0%
Average posting frequency:
- Facebook: 5.9 posts/week (recommended: 3-4/week)
- LinkedIn: 5.3 posts/week (recommended: 3-5/week)
Before you measure yourself against these numbers, set the right expectations. These are reference points, not targets — a financial advisor with a niche audience shouldn't benchmark against a major bank's Instagram. Instead, use the data to spot outliers: channels or content types that land dramatically above or below your industry average are worth investigating, in either direction.
Content format performance: Instagram carousels achieve 4.4% engagement rate for financial services, the highest engagement rate among Instagram formats. LinkedIn video posts lead at 3.9%. Facebook follows a similar pattern — photo and video posts consistently outperform link posts. Format choice, in other words, moves the needle more than posting volume.
Frequently Asked Questions
What are the top social media platforms for financial services marketing?
LinkedIn is best for B2B and professional thought leadership, Facebook offers the largest audience reach and strongest paid ad targeting, and Instagram excels at visual engagement with younger demographics. The right platform depends on your audience and goals — use analytics to confirm where your content actually performs before committing budget.
What is the 70/20/10 rule for social media?
The 70/20/10 framework recommends 70% educational content, 20% brand or culture content, and 10% promotional content. For financial services brands, this balance builds trust before conversion — educational content consistently outperforms promotional posts in engagement metrics.
What is the 5 3 2 rule for social media?
The 5-3-2 rule suggests posting 5 curated pieces from external sources, 3 original content pieces, and 2 personal or behind-the-scenes posts per every 10 posts. This mix helps financial services brands build credibility through third-party content without abandoning their own voice.
What is the 80/20 rule for financial advisors?
The 80/20 principle holds that 80% of results come from 20% of efforts. In social media, that means using analytics to identify your highest-performing content types or platforms — then concentrating resources there instead of spreading them thin.
What are the 4 P's of marketing in financial services?
The 4 P's are Product, Price, Place, and Promotion. In financial services, "Place" refers to distribution channels (including social media platforms), and "Promotion" encompasses marketing communications. Social media analytics tells you precisely which platforms your audience uses and which promotional messages drive action — making it essential for optimizing both.