Native platform analytics don't help much here. Instagram Insights, LinkedIn Analytics, and Meta's dashboard each tell their own story — in their own format, on their own timeline. Pulling meaning from five separate dashboards isn't measurement. It's archaeology.
A social media scorecard fixes this. Instead of drowning in data, you work from a single, focused view that connects your social activity to real business outcomes.
This post covers what a scorecard is, which metrics belong on it, how to build one, and how to use it to drive decisions — not just generate reports.
Key Takeaways
- A social media scorecard consolidates your most important KPIs into one focused view — built for decisions, not data overload.
- Only metrics tied to your specific goals belong on a scorecard — not everything available, and not everything that looks interesting.
- Build yours in six steps: set goals, choose platforms, select metrics, set up tracking, establish cadence, and act on what you find.
- Moving from vanity metrics (likes, follower counts) to value metrics (conversions, engagement rate, sentiment) is what makes a scorecard useful to leadership.
- The 2025 Sprout Social Index reports that 65% of leaders want direct connections between social campaigns and business goals — a scorecard is how you prove it.
What Is a Social Media Scorecard?
A social media scorecard is a structured, goal-aligned document or dashboard that tracks a curated set of KPIs — measured against specific business objectives. It surfaces the right numbers at the right time — enough to act on, not so much that you're buried in data.
Scorecard vs. Full Report
These are two different tools for two different audiences.
| Format | Purpose | Audience | Length |
|---|---|---|---|
| Scorecard | Decision-ready snapshot | Executives, leadership | One page or one view |
| Full report | Comprehensive performance review | Marketing team, analysts | Multi-page, retrospective |
Sprout Social describes the scorecard as a tool for communicating "contextualized metrics — such as sentiment analysis, customer satisfaction, and competitor benchmarks — to executive leadership." A full report suits quarterly deep dives. A scorecard is what you bring to a monthly check-in.
Types of Scorecards
Scorecards aren't one-size-fits-all. Common formats include:
- Brand performance: reach, engagement, and audience growth across channels
- ROI-linked: conversion metrics, pipeline influence, and cost per lead
- Competitor benchmarking: share of voice and relative engagement against rivals
- Social customer care: response time, resolution rate, and brand sentiment
The right format depends on what you're trying to prove — a B2B team tracking pipeline influence needs an entirely different scorecard than a nonprofit measuring community reach.
Key Metrics to Include in Your Social Media Scorecard
Here's the governing principle: metrics belong on a scorecard because they answer a specific business question — not because the platform makes them easy to export.
Start by asking: "What does success look like for this channel right now?" Then work backward to find the 3–5 numbers that actually answer that.
Awareness and Reach Metrics
These tell you whether the right people are seeing your content.
- Impressions: total times content was displayed; useful for tracking paid amplification
- Reach: unique accounts who saw your content; Facebook's average organic reach sits at just 1.65%, Instagram at 3.50% (Socialinsider, 2025)
- Follower growth rate: percentage growth over a defined period, not raw follower count
- Share of voice: your brand's mentions as a percentage of total category conversation; formula: (your mentions ÷ total market mentions) × 100
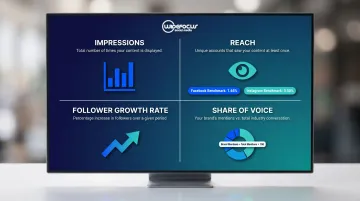
When impressions drop or reach stagnates, that's typically a strategy problem — and the scorecard catches it before it becomes a revenue problem.
Engagement Metrics
Engagement tells you whether content is resonating — but volume alone isn't the measure.
- Engagement rate by reach: the most useful calculation for comparing across platforms and time periods
- Saves and shares: weighted more heavily than likes by Instagram and TikTok's algorithms; saves signal intent, shares signal social proof — and content worth bookmarking
- Comment quality: a post with 200 bot comments isn't performing; genuine dialogue is the signal worth tracking
Note on bot contamination: A peer-reviewed study in Nature/Scientific Reports (2025) found 20% of social chatter about global events comes from bots, spiking to 43% during politically charged periods. High engagement volume without quality signals is worth flagging.
Conversion and Revenue Metrics
These are the metrics that win budget conversations.
- Click-through rate (CTR): LinkedIn Sponsored Content averages 0.44–0.65%; Document Ads reach 1.10%
- Conversion rate from social traffic: tracked via Google Analytics as goal completions from social referral sessions
- Cost per lead (CPL): LinkedIn averages $94 cross-industry, though B2B SaaS often runs closer to $79
- Social attribution to pipeline: what percentage of qualified opportunities touched social before converting
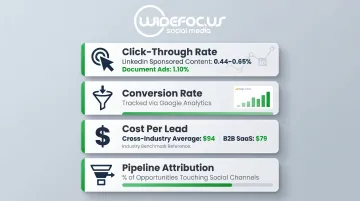
68% of marketing leaders still use engagement metrics to define ROI, while only 57% use revenue (Sprout Social, 2026). A scorecard that connects social activity to pipeline gives finance and leadership a number they can work with.
Customer Care and Brand Health Metrics
- Response time: 76% of consumers expect a brand response within 24 hours; 73% will switch to a competitor if they don't get one
- Resolution rate: percentage of customer issues resolved via social without escalation
- Brand sentiment: ratio of positive, neutral, and negative mentions tracked through social listening
- Earned media value (EMV): converts organic impressions and engagement into a dollar equivalent based on what equivalent ad placement would cost
Brand health metrics surface what audiences actually think about your brand — independent of what you publish. That makes them your earliest warning system for reputation issues before they escalate.
How to Build a Social Media Scorecard: Step by Step
Most teams build scorecards around the data they already have, then try to justify it after the fact. That's backwards. A scorecard that actually drives decisions starts with goals and works forward to the metrics that prove whether you're hitting them.
Step 1 – Define Your Goals
Identify the business questions your scorecard needs to answer:
- "Are we growing awareness among decision-makers in our target market?"
- "Is social media generating qualified leads?"
- "How is our brand sentiment trending quarter over quarter?"
Without clear goals, every metric carries equal weight — and equal weight means no priorities, no decisions, and no accountability.
Step 2 – Choose Your Platforms
Not every platform belongs on every scorecard. Select platforms based on two criteria: where your audience is most active, and where your content investment is highest.
Tracking five platforms at equal depth dilutes focus. For most businesses, two or three platforms drive the vast majority of meaningful results. For B2B companies, LinkedIn alone accounts for roughly 80% of B2B leads sourced from social media — that prioritization should be reflected in scorecard structure.
Step 3 – Select Your Metrics
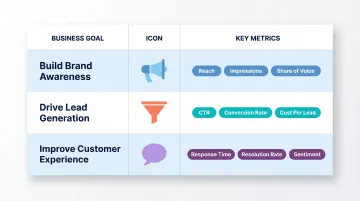
Map each goal to 2–3 specific metrics from the categories above. A scorecard with 20 KPIs is just a report with a different name.
Example mapping:
| Goal | Metrics |
|---|---|
| Build brand awareness | Reach, impressions, share of voice |
| Drive lead generation | CTR, conversion rate, cost per lead |
| Improve customer experience | Response time, resolution rate, sentiment |
Step 4 – Set Up Tracking and Data Sources
Identify your data sources before you need them:
- Native analytics — LinkedIn Analytics, Instagram Insights, Meta Business Suite
- Google Analytics — social referral traffic, goal completions, bounce rate by source
- Third-party tools — scheduling platforms, social listening tools for sentiment and SOV
- Agency reporting — WideFoc.us includes Google Analytics integration as part of its standard reporting services for clients
Consistent data collection intervals matter. Pulling data on different days each month creates comparison errors that undermine trend analysis.
Step 5 – Establish Your Reporting Cadence
Different metrics warrant different review frequencies:
- Weekly — response time, post volume, paid campaign spend
- Monthly — engagement rate, reach, website traffic from social
- Quarterly — ROI, sentiment trends, goal reassessment, metric selection review
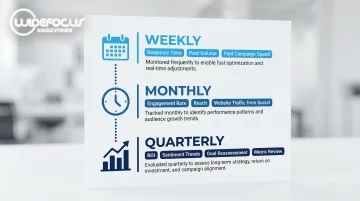
Without consistent cadence, you're comparing apples to oranges every time you pull data. WideFoc.us structures client reporting around monthly insights meetings covering both organic and paid performance, with strategy adjustments built into each cycle.
Step 6 – Analyze, Act, and Refine
Data on a scorecard is only valuable when it triggers a decision. Each review cycle should end with at least one concrete action:
- Adjust content format or posting frequency
- Shift budget toward better-performing platforms
- Test a new CTA approach based on low CTR data
- Double down on content types generating saves and shares
Those tactical adjustments feed into a larger question: are you measuring the right things? Revisit your metric selection every quarter — if business goals have shifted, your scorecard should reflect that before the next reporting cycle begins.
Social Media Scorecard in Action: A B2B Example
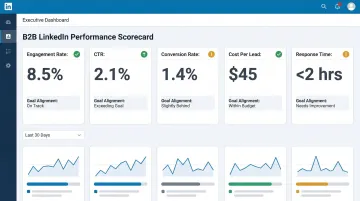
Consider a B2B company that wants to use LinkedIn to generate leads and demonstrate ROI to leadership. Here's what their scorecard might look like in practice.
Setting Up the Scorecard
Goal: Generate marketing qualified leads via LinkedIn and prove social ROI to the executive team.
Platform focus: LinkedIn (primary), supplemented by Google Analytics for traffic attribution.
Metrics selected:
| Metric | Why It's There |
|---|---|
| LinkedIn engagement rate | Measures content resonance with target audience |
| CTR on sponsored content | Tracks movement from awareness to intent |
| Conversion rate from social traffic | Shows how many clicks become leads (via GA) |
| Cost per lead | Connects ad spend to business outcomes |
| Response time on LinkedIn messages | Monitors sales responsiveness on the platform |
What the First Month Revealed
Strong impressions. Low CTR. The content was reaching the right people but not moving them to act. That gap pointed directly to the calls-to-action — generic language that didn't give the audience a clear reason to click.
Three actions followed:
- Rewrote CTAs on the top five performing post formats
- A/B tested a direct value offer against a thought leadership prompt
- Shifted 20% of paid budget toward Document Ads (which average 1.10% CTR versus 0.61% for standard Sponsored Content)
Month Two: The Scorecard as a Living Tool
CTR improved and cost per lead dropped. The scorecard didn't just confirm the result — it traced it back to a specific decision, which made the next round of optimization faster and better-informed.
This mirrors what WideFoc.us documented for a B2B fintech client: consistent content plus paid amplification drove over 1.2 million monthly impressions and 3,000+ website clicks, making social media their top-performing marketing-generated traffic source.
How WideFoc.us Helps You Turn Social Data Into Strategy
Building a scorecard is straightforward in theory. Maintaining one — and actually using it to make decisions — is where most teams stall.
WideFoc.us works with B2B and B2C brands, nonprofits, and global corporations to build measurement frameworks tied to real business objectives. Founded by Eric Elkins in 2007, the Denver-based agency brings over 20 years of social media strategy experience to client engagements — with 2024 results including over 20 million impressions and 1 million link clicks across client accounts.
The process starts with discovery: understanding your goals, audience, challenges, and existing channels before a single metric gets selected. That foundation shapes the reporting structure — monthly insights meetings, platform-level analytics, and Google Analytics integration — built to convert performance data into decisions, not just documentation.
Two engagement paths are available depending on where your team stands:
- Consulting packages from $3,000 — includes a channel scorecard or full audit, actionable recommendations, and optional monthly coaching for teams building internal capabilities
- Full-service retainers — WideFoc.us manages the measurement process end to end for brands that want ongoing strategy and execution support
The engagement starts with the right questions — about your goals, your gaps, and what success actually looks like for your business.
Frequently Asked Questions
What is a social media scorecard?
A social media scorecard is a focused tracking document or dashboard that consolidates a curated set of KPIs aligned to specific business goals. Unlike a comprehensive analytics report, it's designed for quick decision-making — typically one page or one view — rather than exhaustive performance documentation.
What are the top 3 website KPIs to track from social media?
Social referral traffic, conversion rate from social sessions, and bounce rate from social sources. Together, these three metrics reveal whether your social content is attracting the right audience and whether that audience is taking meaningful action once they land on your site.
What are the big 4 social media tool categories?
Scheduling (content planning and publishing), analytics (performance tracking), social listening (sentiment and mentions), and reporting (aggregating data into dashboards). The best tools depend on your team size, platform mix, and budget — no single stack is universal.
How much does a social media consultant charge?
Rates vary widely. US-based agencies typically run $100–$149/hour, with monthly retainers ranging from $3,000 for consulting to $4,500–$11,000 for full-service management. Consultants who tie reporting to pipeline and revenue tend to deliver stronger long-term ROI than those focused solely on content output.
What are the 5 C's of social media?
Content, Community, Conversation, Collaboration, and Conversion. Each maps to a measurable metric — from content performance and audience growth to engagement quality, UGC reach, and revenue attribution. Tracking all five gives you a complete picture of social impact.
What are the 4 E's of content?
Educate, Entertain, Engage, and Empower. Knowing which "E" a piece of content serves helps you pick the right metric. Educational content should drive saves and shares; content built to empower is better measured by CTR and conversion rate.