That silence is where most B2B social media programs live. The activity is visible. The business impact isn't.
The problem isn't that B2B social media ROI is unmeasurable — it's that measuring it accurately requires a fundamentally different approach than B2C. Long sales cycles, multiple decision-makers, and multi-touch buyer journeys mean last-click attribution will always undercount social's contribution. According to CMI's 2025 B2B Content Marketing research, 56% of B2B marketers cannot attribute ROI to their content efforts — not because social doesn't work, but because they haven't built the infrastructure to prove it.
This guide covers the ROI formula, the metrics that actually connect to revenue, a five-step measurement process, and the strategies that move the needle.
Key Takeaways
- ROI formula: (Revenue Generated – Total Investment) / Total Investment × 100 — but accurate calculation requires tracking the full buyer journey, not just last-click conversions
- Vanity metrics (likes, followers, impressions) can't justify a budget — track pipeline influenced, cost per SQL, and LTV:CAC instead
- B2B sales cycles span 3–18 months with 6–13 stakeholders per deal — multi-touch attribution is the only model that captures the full picture
- Better ROI starts with measurement infrastructure (UTM tracking, CRM integration) and content built to move buyers through the funnel
- LinkedIn drives the majority of B2B social leads with a 2.74% visitor-to-lead conversion rate — nearly 4x higher than Facebook or Twitter
Why B2B Social Media ROI Is Harder to Measure Than It Looks
The Attribution Problem Is Structural
B2B buyers don't follow a straight line from LinkedIn post to signed contract. Gartner's B2B Buying Journey research documents an average of 27 touchpoints before a purchase decision — spread across channels, devices, and months. A prospect reads a LinkedIn article in January, attends a webinar in March, downloads a case study in April, and closes in May. Last-touch attribution credits the case study. Social gets nothing.
Enterprise deals run even longer. B2B software sales cycles range from 3–6 months for mid-market and 9–18 months for enterprise, meaning a post published today may influence a deal that doesn't close until next year.
Multi-Stakeholder Complexity Compounds the Problem
Unlike B2C, where one person usually decides and buys, Forrester's 2024 State of Business Buying report found that an average of 13 people are involved in B2B purchases, with 89% of purchases involving 2+ departments. Procurement, legal, finance, and department heads each consume different content at different stages — and some of those interactions (internal email forwards, offline conversations, executive referrals) never appear in any analytics tool.
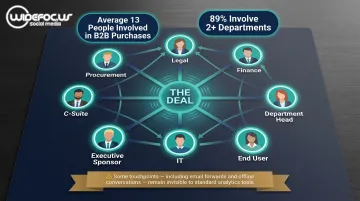
This artificially deflates social media's apparent contribution. The deal was influenced; the data just can't see it.
Why Vanity Metrics Persist
That attribution blind spot explains why vanity metrics remain so sticky. Social platforms surface reach, engagement, and follower growth by default — so that's what gets reported. Impressions aren't worthless, but they can't answer the question leadership is actually asking: did this contribute to pipeline?
The goal isn't to abandon engagement tracking. Connecting those engagement signals to downstream outcomes — pipeline influence, sourced leads, closed revenue — is what transforms a social media report into a business case.
The B2B Social Media ROI Formula Explained
The Formula and What It Actually Means
The standard formula:
ROI = (Revenue Generated – Total Investment) / Total Investment × 100
Concrete example: $60,000 in attributed revenue minus $15,000 in total investment equals a 300% ROI. The math is simple. The hard part is accurately capturing both numbers.
What "Total Investment" Actually Includes
Most marketers undercount investment by only including ad spend or agency fees. A complete Total Investment figure covers:
- Internal team time (strategy, writing, approvals, reporting)
- Content creation and design costs
- Social media management tools and platform subscriptions
- Paid distribution and boosted post budgets
- Agency or freelance fees
Underestimating investment produces inflated ROI figures that don't survive a finance review. When WideFoc.us onboards B2B clients, the first step is mapping every cost — internal hours, tools, and fees — before a single ROI number gets calculated. Numbers that omit real costs mislead rather than inform.
The Compounding Value of Organic Content
Unlike paid ads that stop delivering the moment spend stops, organic social content — especially thought leadership — compounds over time. HubSpot's compounding posts research found that while only 10% of content becomes "compounding," it generates 38% of total traffic — and keeps generating it months or years after publication.
Organic content is an asset, not an expense — and ROI models need to treat it that way. A LinkedIn article published this quarter can still influence a deal a year from now. Models that only measure 30-day windows will miss that value entirely.
Key Metrics That Actually Matter for B2B Social Media ROI
The most useful distinction in B2B social measurement: leading indicators predict future outcomes, while lagging indicators confirm them. You need both. Lagging indicators, though, are what justify budget decisions.
Pipeline and Revenue Metrics
How to Measure B2B Social Media ROI: A 5-Step Process
Step 1: Set Goals Tied to Business Outcomes Before You Post
Measurement starts before the first post goes live. Social media goals must map to actual business objectives — otherwise you're measuring activity, not impact.
How to translate:
- Business goal: "Increase MQL volume by 20%" → Social KPI: "Drive X demo requests from LinkedIn per month"
- Business goal: "Accelerate pipeline velocity" → Social KPI: "Increase content downloads from mid-funnel prospects by X%"
WideFoc.us begins every B2B engagement with a discovery phase built around this exact question: What do you want prospects to do, and what business outcome does that produce? KPIs established before execution are the only ones that mean anything when reporting season arrives.
Step 2: Implement UTM Tracking and CRM Lead Source Fields
Without UTM parameters on every social link, you can't trace conversions back to their source. Structure them consistently:
- Source: linkedin, facebook, twitter
- Medium: social, paid-social, organic-social
- Campaign: campaign name or content theme
When a prospect fills out a form, books a demo, or requests a quote, their journey back to the originating post is traceable. Configure your CRM to capture lead source at first touch and log social touchpoints throughout the buyer journey — not just at conversion.
Step 3: Choose the Right Attribution Model
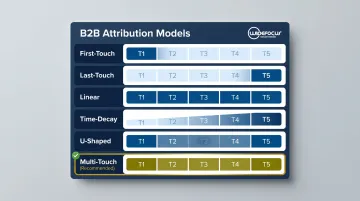
A quick comparison:
| Model | How It Works | Best For |
|---|---|---|
| First-touch | All credit to first interaction | Brand awareness measurement |
| Last-touch | All credit to final touchpoint | Short, simple sales cycles |
| Linear | Equal credit across all touches | Balanced view of full journey |
| Time-decay | More credit to recent touches | When closing activity matters most |
| U-shaped | Heavy weight on first and last | Lead gen + conversion focus |
For B2B with cycles measured in months, multi-touch attribution is the most accurate for B2B because it distributes credit across the full buyer journey. It does require CRM integration with marketing automation to implement properly — and last-touch attribution, the easier alternative, consistently undercounts social's true contribution.
Step 4: Build a Reporting Dashboard That Connects Social to Pipeline
A meaningful B2B social media report includes:
- Traffic from social by channel (organic vs. paid)
- Leads sourced from social
- Opportunities influenced (dollar value)
- Deals closed with at least one social touchpoint
- Cost per lead and cost per SQL by channel
A report showing only reach and engagement tells leadership nothing about business impact. Building this infrastructure is where tooling decisions matter. Google Analytics 4, HubSpot, Salesforce, and dedicated attribution platforms all offer viable pathways — the right choice depends on your existing stack, not any tool's marketing claims.
Step 5: Establish Baselines Before Optimizing
Benchmarks only mean something relative to your own historical data. Run a 60–90 day baseline period before drawing conclusions about what's working — WideFoc.us's minimum engagement period reflects exactly this reality, because one month rarely produces enough data to make confident optimization decisions.
B2B content typically takes 3–6 months to gain traction, with revenue impact often appearing around month 7 or later. Cutting a program at month 3 because pipeline hasn't appeared isn't a data-driven decision — it's impatience producing misleading data.
How to Improve Your B2B Social Media ROI
Publish Content That Moves Buyers, Not Just Content That Gets Likes
Opinion posts and trending topic reactions earn engagement. They rarely build pipeline. B2B audiences — especially on LinkedIn — respond to content that solves real problems they're facing right now.
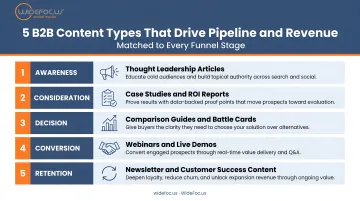
Content types with demonstrated B2B pipeline impact:
- Executive thought leadership: Original perspectives on industry challenges, written by (or attributed to) company leaders
- Case studies: Specific, outcome-focused stories with real numbers
- Implementation guides: Practical how-to content that earns trust during the research phase
- ROI and value calculators: Interactive tools that help buyers build the internal business case
- Buyer-stage educational content: Content that answers the questions prospects have at each stage of a 6–12 month journey
The 2025 Edelman-LinkedIn research found that 60% of B2B decision-makers are willing to pay a price premium to suppliers whose thought leadership they respect — making thought leadership a pipeline tool, not a vanity exercise.
Prioritize LinkedIn, but Build a Supporting Platform Mix
For B2B companies with limited resources, a practical prioritization framework:
- LinkedIn (primary): Lead generation, thought leadership, account-based targeting, executive positioning
- YouTube (secondary): Long-form educational content — 70% of B2B buyers watch video during purchase research
- Instagram (supporting): Brand credibility, culture, and recruiting
- Facebook (selective): Audience targeting for specific verticals; secondary to LinkedIn for most B2B use cases
LinkedIn-first is the right default for most B2B brands. Its 113% ROAS in B2B contexts versus Meta's 29% makes a clear case for putting your primary investment there.
Invest in Executive Positioning and Employee Advocacy
Brand page content consistently underperforms content shared by individual people. Employee-shared content earns 561% more reach and 8x more engagement than the same content posted from a company account (MSLGroup research, widely cited across the industry).
The ROI mechanism: executive thought leadership builds trust at scale, which shortens sales cycles. When a prospect has been following your CEO's LinkedIn posts for three months, the first sales conversation starts warmer. The 2025 Edelman-LinkedIn report found that 41% of target buyers were encouraged to consider a specific vendor after engaging with that vendor's thought leadership.
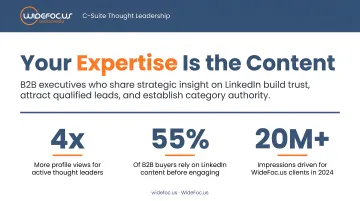
WideFoc.us's C-Suite Thought Leadership service is built around this dynamic: LinkedIn profile optimization, ghostwriting, POV development, and sales team coaching work together to turn executive presence into pipeline.
Test Paid Amplification on High-Performing Organic Content
Once your organic strategy is generating content that resonates, the next step is extending that reach strategically. Rather than launching paid campaigns cold, use paid budgets to amplify organic posts that already show traction. A post with strong organic engagement has already proven its message resonates — paid amplification extends that reach to targeted audiences without the creative risk of starting from scratch.
For B2B brands that want this kind of end-to-end execution — organic strategy, community management, paid amplification, and pipeline-connected reporting — without hiring or building a team in-house, WideFoc.us offers full-service management across all of it.
Review on a Quarterly Cadence, Not Monthly
Monthly engagement reports catch fluctuations. Quarterly reviews catch trends. A meaningful quarterly review examines:
- Pipeline influenced by social (vs. prior quarter)
- Cost per SQL by channel
- Content-to-conversion rates by format
- Which specific posts or campaigns drove downstream action
The output: a clear list of what to scale and what to cut — built on business data, not engagement metrics.
Frequently Asked Questions
How do you measure ROI on social media?
Use the formula: (Revenue Generated – Total Investment) / Total Investment × 100. Accurate measurement requires UTM tracking on every link, CRM lead source fields to capture social touchpoints throughout the buyer journey, and multi-touch attribution to distribute credit across the full funnel — not just the last click before conversion.
What are the best metrics for tracking social media ROI?
Vanity metrics (reach, likes, follower counts) measure activity but don't connect to revenue. ROI-linked metrics — pipeline influenced, cost per SQL, social-attributed revenue, and LTV:CAC — connect social directly to business outcomes. Use clicks and CTR as leading indicators; pipeline and revenue as the lagging metrics that matter to leadership.
What is a good ROI for B2B social media marketing?
A 5:1 revenue-to-spend ratio is the widely accepted benchmark for strong B2B marketing ROI, with 10:1 considered exceptional. That said, social-media-specific benchmarks vary significantly by industry, measurement maturity, and strategy. Improving your own baseline quarter-over-quarter is more actionable than chasing a universal number.
How long does it take to see ROI from B2B social media?
Social content typically takes 3–6 months to build traction, with meaningful revenue impact often appearing around month 7 or later. Unlike paid media, organic social compounds over time — a post published today may still influence deals 18 months from now.
Why is B2B social media ROI harder to track than B2C?
B2B sales cycles run 3–18 months, buying decisions involve 6–13 stakeholders, and multi-touch journeys make simple last-click attribution unreliable. Standard analytics tools aren't built for that complexity — which is why most B2B teams undercount social's actual impact.
What's the difference between vanity metrics and ROI metrics in B2B social media?
Vanity metrics (impressions, follower counts, likes) measure reach and activity but don't connect to revenue. ROI metrics — pipeline influenced, cost per SQL, deal velocity, social-attributed revenue — are what survive budget conversations with finance leadership.