Introduction
Social media advertising has moved well past the experimental stage. What started as a minor line item in digital budgets now commands tens of billions of dollars annually — and the competition for that inventory is only getting sharper.
US social media ad revenues hit $88.8 billion in 2024, according to the IAB/PwC Internet Advertising Revenue Report — a $23.8 billion jump over 2023. That's not a channel you can afford to guess your way through.
Anyone managing a marketing budget in 2025 needs a clear picture of where spend is flowing, which formats are pulling ahead, and what forces are reshaping platform economics. This article covers the current market, the three most consequential trends, and where the numbers are headed over the next few years.
Key Takeaways
- US social media ad spend reached $88.8B in 2024 and is projected to approach $101B by 2028, with growth decelerating to low single digits
- Short-form video (Reels, TikTok, Shorts) is the top-ranked ROI format for marketers three years running
- Social commerce is compressing the purchase funnel, giving brands direct revenue data to justify paid social budgets
- Apple's ATT framework cost Meta an estimated $10B in revenue in 2022, forcing a broader shift toward first-party data strategies
- Brands diversifying budgets across platforms now are better positioned to absorb algorithm changes, policy shifts, and rising CPMs
The State of Social Media Ad Spend: Market Size and Platform Breakdown
Market Size and Growth Trajectory
The headline number for 2024 is $88.8 billion in US social media ad revenue — but that figure comes with an asterisk. Statista-based projections via Oberlo estimated 2024 US spend closer to $76.4 billion, with the gap reflecting methodology differences between measured format revenue (IAB) and market outlook modeling (Statista).
Either way, the trajectory is clear:
- 2017–2021 average annual growth: ~31%
- Projected 2025–2028 growth rate: low single digits (3–5% annually)
- Projected 2028 total: approximately $101.5 billion
Growth is decelerating, but absolute spend keeps climbing. For marketers, that shift matters: when rapid channel growth masked weak targeting, mediocre campaigns could still post acceptable returns. At today's slower growth rates, precision and efficiency determine who wins.
Platform Hierarchy
Social networks are projected to claim roughly 32% of total US digital ad spend in 2026, according to eMarketer. Meta (Facebook + Instagram combined) commands the largest share of social ad budgets by a significant margin. Platform usage among marketers worldwide in 2025 breaks down as follows:
- Facebook — used by 86% of marketers
- Instagram — 76%
- LinkedIn — 64%
- YouTube — 54%
- TikTok — 33%
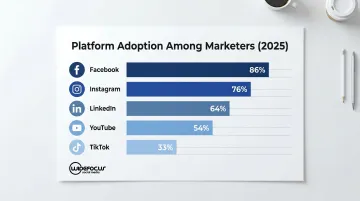
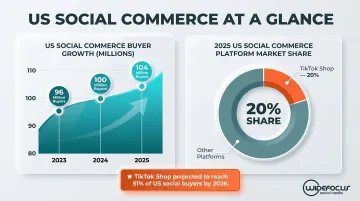
Usage doesn't equal spend share, but it signals where advertiser attention concentrates. TikTok sits last on that list by adoption — yet its commerce influence punches well above its marketer usage rate. TikTok Shop captured nearly 20% of all US social commerce in 2025, and eMarketer projects 51% of US social buyers will shop on TikTok in 2026. Regulatory uncertainty around the platform eased considerably after ByteDance finalized a majority American-owned joint venture in January 2026, reducing the platform viability risk that had kept some advertisers cautious.
Platform Spend Snapshot
Cost benchmarks vary widely by vertical, objective, and creative quality. These ranges offer a directional starting point for allocation decisions:
| Platform | Avg CPC | Avg CPM |
|---|---|---|
| $0.63–$0.97 | $12–$15 | |
| $0.40–$1.23 | $8–$12 | |
| TikTok | ~$1.00 | $6–$10 |
| $5.26–$5.58 | ~$30 | |
| ~$1.50 | ~$30 |
LinkedIn's premium CPC reflects its B2B targeting precision — decision-maker audiences don't come cheap. TikTok and Pinterest remain relatively low-cost entry points, particularly for B2C brands testing new formats. LinkedIn's wide CPC gap from the rest of the field also explains why B2B brands treat it as a separate budget line rather than a direct competitor for the same dollars as Facebook or Instagram.
Trend 1: Mobile-First Advertising and the Short-Form Video Surge
Short-form video has moved from a trend worth watching to a budget line worth defending. Marketers now rank it as the No. 1 ROI format for the third consecutive year, and 57% of marketing budgets include a dedicated short-form line item in 2026.
The audience scale backing that investment is substantial:
- YouTube Shorts: ~200 billion daily views and 2 billion MAUs
- Instagram Reels: reach rates around 30.81% of followers
- TikTok: average time spent of ~95 minutes per day per user
Why Algorithms Amplify Paid Video
Platform algorithms consistently favor short-form video in organic distribution — Reels and TikTok content outperform static posts in organic reach by measurable margins that compound over time. Paid placements benefit from the same algorithmic preference — and strong creative regularly generates organic halo reach on top of paid impressions, effectively extending media budgets without additional spend.
That algorithmic reach operates across a massive and growing audience. DataReportal reports approximately 5.24 billion global social media users as of January 2025, rising to roughly 5.79 billion by April 2026. In the US alone, 253 million active social media identities represented 73% of the population.
The Hidden Cost: Creative Production
One budget implication that doesn't show up in CPM benchmarks: short-form video requires more creative volume. Algorithmic feeds burn through content faster than static ad sets, and creative fatigue arrives sooner. Brands shifting budgets toward Reels and TikTok are simultaneously increasing content production costs — sometimes significantly.
A practical rule of thumb: for every dollar added to short-form video media spend, budget an additional 20–30% for creative production to sustain performance without fatigue.
Trend 2: Social Commerce Is Turning Ad Budgets Into Direct Revenue Channels
Social commerce removes the gap between ad exposure and purchase. Features like Instagram Shopping, TikTok Shop, and Pinterest Product Pins let users discover, evaluate, and buy without leaving the platform. The traditional funnel — awareness, consideration, conversion — compresses into a single session.
That compression reshapes how ad spend gets evaluated — in two concrete ways:
- Attribution becomes cleaner. In-platform purchases generate direct conversion data, making it easier to connect ad dollars to revenue outcomes.
- Finance conversations get easier. When a campaign produces trackable sales rather than click traffic, justifying the budget to leadership is a different conversation.
Who's Buying and Where
The US social commerce audience has grown from roughly 96 million buyers in 2023 to approximately 104 million in 2025. TikTok Shop's 20% share of US social commerce makes it a platform B2C brands can't ignore — even brands that came late to TikTok advertising are running commerce-specific campaigns now.
The verticals seeing the strongest traction are no accident:
- Fashion and beauty — high visual appeal, quick decisions
- Consumer goods — broad reach, low barrier to impulse purchase
- Food and beverage — discovery-driven buying that maps naturally to scrolling behavior
What they share: visually compelling products with short consideration cycles, which suits how in-app shopping actually works.
B2B Isn't Sitting This Out
B2B brands are adapting the social commerce model to fit their own conversion goals. LinkedIn's lead gen forms — which let prospects submit contact information without leaving the platform — follow the same logic as in-app checkout: remove steps, increase completions. For B2B campaigns where the conversion event is a demo request or content download rather than a purchase, shortening that path moves the needle just as much.
WideFoc.us has seen this pattern play out across client campaigns. For a B2B fintech client, LinkedIn-led paid campaigns became a top-performing source of marketing-generated traffic, with lead quality tied directly to MQL and pipeline metrics rather than just click volume.
Trend 3: AI-Powered Targeting and the Privacy Paradox
AI Is Increasing Ad Efficiency
Meta's Advantage+ campaigns and TikTok's Smart Performance Campaigns automate audience selection, creative rotation, and budget pacing in ways that reduce manual setup time. Retail advertisers spent more than one-third of their Meta budgets on Advantage+ sales campaigns in Q2 2025, according to Tinuiti data cited by eMarketer.
The efficiency gains are real, but results aren't universal. An independent analysis of 55,661 Meta ad campaigns found that manually configured setups achieved lower new customer acquisition costs than Advantage+ in that dataset (Wicked Reports, 2025).
The practical takeaway: AI campaign tools are worth testing, but performance varies by account structure, creative quality, and audience data richness. They're not a plug-and-play solution.
What is shifting consistently: the skills required to run effective paid social. The job is less about building targeting parameters from scratch and more about interpreting AI outputs, setting strategic guardrails, and supplying high-quality creative inputs.
Privacy Changes Are Forcing Budget Reallocation
Apple's App Tracking Transparency (ATT) framework, rolled out in 2021, had measurable consequences. Meta estimated a roughly $10 billion revenue headwind in 2022 from reduced tracking signal. Advertisers saw CPMs rise and audience precision decline.
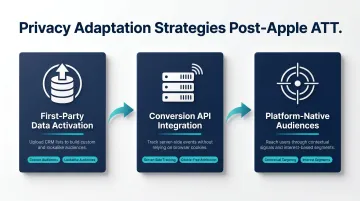
Brands that adapted quickly moved toward:
- Activating first-party data by uploading CRM lists and email audiences for custom and lookalike targeting
- Implementing Conversion API integrations for server-side event tracking that doesn't rely on browser cookies
- Using platform-native audience tools — contextual and interest-based segments that bypass cross-app tracking
These tactics translate directly into measurable results when executed well. For a DTC supplement brand, WideFoc.us partnered with a data provider to build custom audiences from the purchase behaviors of more than 220 million American consumers, generating over 1 million impressions and 4,030 link clicks at $0.45 cost-per-click in the first campaign month.
What's Driving These Trends — and How They're Impacting Brands
Three structural forces are behind the market's trajectory:
- User scale: ~5.79 billion global social media users by April 2026 — the audience isn't going anywhere
- Time-on-platform: US users average over two hours of social media time daily, providing abundant inventory
- Proven ROI: Social ads consistently outperform many traditional channels on measurable outcome metrics
As more brands advertise, auction dynamics push CPMs and CPCs upward. More competition for the same inventory means brands that can't improve creative quality and targeting precision will pay more for worse results over time.
What This Means Operationally
Budget allocation decisions carry higher stakes than they did five years ago. Spreading spend thin across every platform — hoping something works — is an increasingly expensive strategy. Brands that concentrate spend where their audience actually is, in formats those audiences respond to, pull ahead of those chasing platform count.
In-house marketing teams are being compressed on both ends: tighter budgets, higher creative demands, and more platform complexity — all at once. That's pushing real demand toward agency partnerships that combine paid social expertise with content production capacity.
WideFoc.us offers managed services built around this reality. Retainers run $4,500–$11,000 per month depending on scope, covering organic content strategy, platform management, and paid social across Meta, LinkedIn, TikTok, and Pinterest.
Paid social management starts at $300 for smaller budgets or 20% of ad spend above that threshold, with a 90-day minimum to allow optimization cycles to stabilize.
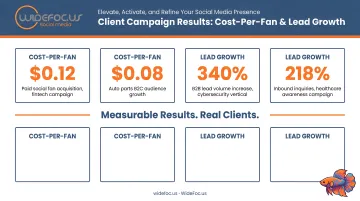
The agency's results across client campaigns illustrate what deliberate management produces: a B2B auto parts company saw 9,000+ new fans in a single month at $0.05 cost-per-fan (versus an industry benchmark of $1.00), while a regional home services client saw a 9x increase in qualified leads within eight weeks.
Future Signals for Social Media Ad Spend (2025–2027)
Several developments are worth tracking closely:
- AI-generated ad creative is projected to grow from ~8% of US ad revenue in 2025 to roughly 26% by 2030 (Madison and Wall). Lower creative production barriers could democratize access to high-quality paid social — but also flood platforms with more competing content.
- Threads ads are now rolling out to all global users, adding another Meta advertising surface. For brands already running Meta campaigns, it's a low-friction expansion worth testing early.
- LinkedIn's B2B trajectory continues upward. LinkedIn recently surpassed $2 billion in ad revenue, and its share of B2B budgets is growing — particularly for account-based marketing and executive thought leadership campaigns.
- YouTube Shorts monetization is maturing. Alphabet reported over $60 billion in total YouTube revenue, and as Shorts inventory becomes more integrated into standard YouTube buying, it will pull more budget from TikTok and Reels.
Brands that outperform over the next three years tend to share three habits:
- Flexible budget structures that can shift across platforms as conditions change
- Early creative testing in emerging formats before competition drives up CPMs
- Optimization driven by platform-level performance data — not category benchmarks
Locking social ad spend into a fixed annual allocation makes it nearly impossible to act on these signals when they matter most.
Frequently Asked Questions
How much is spent on social media advertising?
US social media ad revenues reached $88.8 billion in 2024, according to IAB/PwC data. Statista-based projections estimate the market will reach $101.5 billion by 2028, driven by expanding user bases and increased advertiser adoption across platforms.
Which social media platform gets the most ad spend?
Meta (Facebook and Instagram combined) commands the largest share of social ad budgets globally, well ahead of competitors. TikTok, YouTube, LinkedIn, and Pinterest follow, with TikTok closing the gap fastest as its commerce and advertiser tools mature.
How much did social media usage increase in 2020?
Kantar's COVID-19 Barometer reported that social media engagement increased by 61% over normal usage rates during the pandemic. WhatsApp usage rose 40% and Facebook usage climbed 37%, setting the stage for accelerated ad spend growth in 2021 and beyond.
What is the 5-5-5 rule on social media?
The 5-5-5 rule is an organic engagement framework: spend 5 minutes commenting on others' posts, 5 minutes engaging with recent followers, and 5 minutes sharing value-added content. It applies to community-building strategy, not paid campaigns. That said, active organic engagement tends to improve the conditions paid campaigns perform in.
How is AI changing social media advertising budgets?
Tools like Meta Advantage+ and TikTok Smart Performance Campaigns automate audience targeting and budget pacing, improving efficiency for many advertisers. They do raise the bar for creative quality, though, and still require strategic oversight to perform well.
Is social media advertising worth it for small businesses?
Yes — platforms like Pinterest and Instagram offer relatively low entry-point CPCs, making paid social one of the more cost-accessible digital channels. Results depend on clear campaign objectives, defined audiences, and consistent creative testing rather than budget size alone.